Err—not quite.
Whilst this tweet is painfully relatable, it also saddens me. This goes to show there are so many Node.js developers out there who are debugging their applications the caveman way. But debugging Node.js needn’t be this hard.
The more you relate to this tweet, the more you must read on. Your sanity begs you.
Today we’re going beyond just logging everywhere in your application. Many resources on Node.js debugging go through only one single method, but in this article, we’re going to cover ten unique tools you can use to debug your Node.js application like a pro.
Testing shouldn’t be controversial. Yet spending the past few years as a consultant developer, I’ve now seen so many teams hand-wave at test-driven development and opt instead to put themselves into a world of pain. The tests you skip writing today will short-change your future developers’ debugging abilities.
Tests are so useful during debugging because you can use them as documentation of your code’s behavior and APIs. When you’re rifling through code searching for a bug and stop to ask yourself, “Hold up, why are they using a .forEach, not a .map?” it is immeasurably helpful to see the creator’s thoughts encapsulated in test case descriptions and example code.
If you want to get up and running with tests, I can highly recommend Jest as a unit testing library. Not only is Jest super fast, but it comes with lots of goodies as well, such as the ability to create coverage reports by passing a coverage flag to your testing reports. But one of my absolute favorite features for Jest is how you can mock required dependencies simply.
If you’re building APIs, SuperTest is a great testing library for API endpoints. SuperTest is particularly cool because you can pass it an Express app object directly. This means you don’t have to have the app running separately, and it makes mocking dependencies such as database connections easy.
But wait, there’s more!
Combine your Jest unit tests with your SuperTest ones with Husky (a Git hook utility) pre-commit hook, and you can run all your unit and integration tests before your code even leaves your machine. I absolutely love this.
Ah, the humble console.log.
Most JavaScript developers are familiar with the console log. If you’re not, it simply takes a string or an object and prints it. But what most developers don’t know is that the console object itself has many more useful methods that are often left underutilized. Let me show you a couple of my favorites.
console.group
By running console.group, you create a new collection of JavaScript console logs. In the browser, this would nest all your logs together. However in Node.js, since you only have the console to log to, each group is indented like so:
I am a console log indented by a single level
    I am a multilevel nested console log
console.table
Next up is console.table. Console.table does what you’d expect it to: it takes an array or an object and outputs an ASCII table. This is particularly useful for long or large objects with many properties, as it gives us more structure which can help with readability, like so:
┌─────────┬────────┐
│ (index) │ Values │
├─────────┼────────┤
│    0    │    1   │
│    1    │    2   │
│    2    │    3   │
└─────────┴────────┘
console.dir
Last up, console.dir.
The reason I’m giving this a shoutout is because it takes two arguments, the last of which is the important one.
The first takes an object; the second takes an object of options. In this options object, you can specify the depth of your console log. If you have ever tried to console log a native Node.js object and gotten a HUGE output, you’ll know how hard it is to read.
But instead, with console.dir and a depth property, you get the following:
process {
    title: 'node',
    version: 'v10.8.0',
    versions: [Object]
    ...
Instead of showing all the child properties (note the versions property) you get:
process {
    title: 'node',
    version: 'v10.8.0',
    versions: {
        http_parser: '2.8.0',
        node: '10.8.0',
        v8: '6.7.288.49-node.19',
        ...
Play around with console
If you’re keen to play with the different methods, simply copy the following code file:
// Example 1: console.log
// ======================
console.log('I am a regular console log.');
console.group();
console.log('I am a console log indented by a single level');
console.group();
console.log('I am a multilevel nested console log');
console.groupEnd();
console.groupEnd();

// Example 2: console.table
// ========================
const people = [["John", "Smith"], ["Jane", "Doe"], ["Emily", "Jones"]]
console.table(people);

// Example 3: console.dir
// ======================
const object = {
    name: "Lou",
    likes: ['JavaScript', 'Node.js']
};
console.dir(process, {colors: true, depth: 0 })
Save the file as app.js and run with the command:
node app.js
Now you’ll see the output of all the three different console commands, and you can experiment with them to get a better feel for how they change the debugging experience. Rather than just having plain console logs, now you’ll have structured entries, that should be easier to make sense of, and more suited to the debugging style that you’re performing.
Okay, now that you’re a master of the console log, it’s time to take it up a notch.
Enter: the debugger statement.
For those coming straight to Node.js who haven’t developed in the browser, the debugger statement is one of the simplest ways to get started with debugging. In the browser, a debugger statement simply pauses the execution of your code when the statement is reached…but only if you have the developer tools open.
If you want to quickly try this out, open up your dev tools and paste the following into the console.
(() => debugger;)()
You’ll see the browser stops executing on this line, which allows you to see all the scoped variables at this point in time and experiment with executing code.
In Node.js, however, there is no developer console, which means that we have to do things a little differently. We have to do the equivalent of opening up the developer tools, but this time inside of Node.js. And we do that by using Node.js’ inspect.
For instance, take the following example app:
const express = require('express');
const app = express();

app.get('/', (req, res) => {
    debugger;
    res.send('Hello World!');
});

app.listen(3000, () => console.info('Example app listening on port 3000!'));
Now instead of starting your app as you usually would:
node app.js
You can start your app with the following command:
node inspect app.js
And you’ll be dropped into an interactive debugger. In the command line, this allows you to step through code execution.
So I must admit, this is a very primitive method of debugging.
However, I intentionally wanted to show you all the different ways to debug in Node.js so that in the future if you come across this method, you know how it works. While this method works for small Node.js scripts and apps, for more serious debugging, you might need something more powerful.
So let’s take a look at what these methods are.
For debugging Node.js apps, this is by far my favorite method.
When Node.js was created, it felt like we lost all of the debugging capabilities of the browser. But with the inspect flag, you get most (though not all) of these capabilities back.
The way this works is: you pass a flag to your node process before you start the Node application. This tells Node.js that you want to run in debugging mode. Node.js will then start a WebSocket connection that will allow you to remote debug from your browser.
node --inspect app.js
Hold up for one second; you want to be careful to not confuse the—inspect flag with the inspect command (from tip three). The former launches the CLI debugger, whereas the latter launches the browser-based debugger.
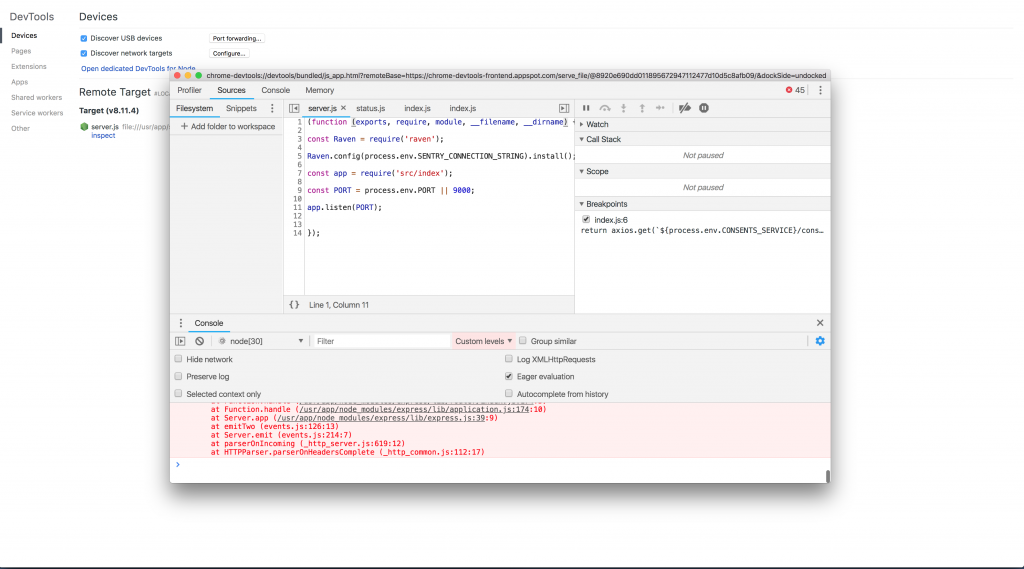
Now if you’re using Chrome, you can head over to the chrome://inspect#devices page and you’ll see a section called remote target. This will show all of your running node processes that you are using that have been executed with the inspect flag.
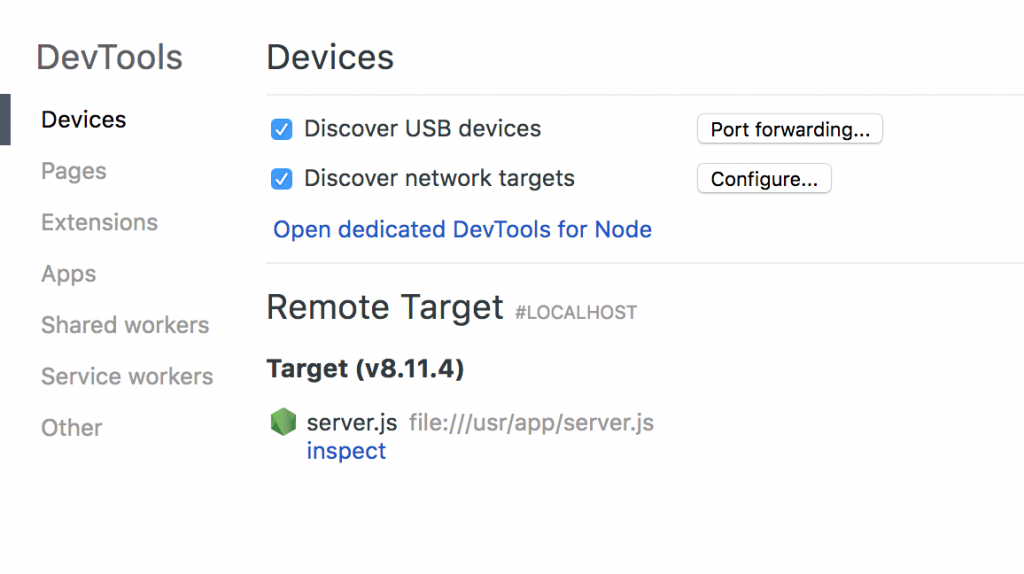 Click your app in the list and you’ll be sent into a debugging terminal in Chrome!
There’s not too much more we need to say about debugging with the inspect flag. If you’re trying to catch small-ish bugs, this is the best method.
But it’s not the only method.
If you thought stepping through your code in your browser was cool, you might like this even more: some IDEs make use of the inspect flag and allow you to do remote debugging without even leaving your IDE.
These IDE tools work in much the same way as before. You’ll need to attach an inspector to your node process and then listen on the WebSocket that is created for your debugging purposes.
I’m a big fan of VS Code, and since it’s the most popular JS IDE, let me walk you through how to set up debugging in VS Code. Note that the same can be done in WebStorm, if that’s what you’re into.
To start, copy the following Express app (and save the file as app.js):
const express = require('express');
const app = express();

app.get('/', (req, res) => {
    res.send('Hello World!');
});

app.listen(3000, () => console.info('Example app listening on port 3000!'));
Then, run your app with the following command:
node app.js
And you should see the output:
Example app listening on port 3000!
You may notice that (unlike before) we’re not passing the—inspect flag. There are two ways to set up your node process with inspect mode, either by passing the flag from within your IDE or through your IDE. So let’s explore the new approach, via your IDE.
Now that your app is running, go to VS Code and open the command palette, either with the view tab or by pressing:
Shift + Cmd + p
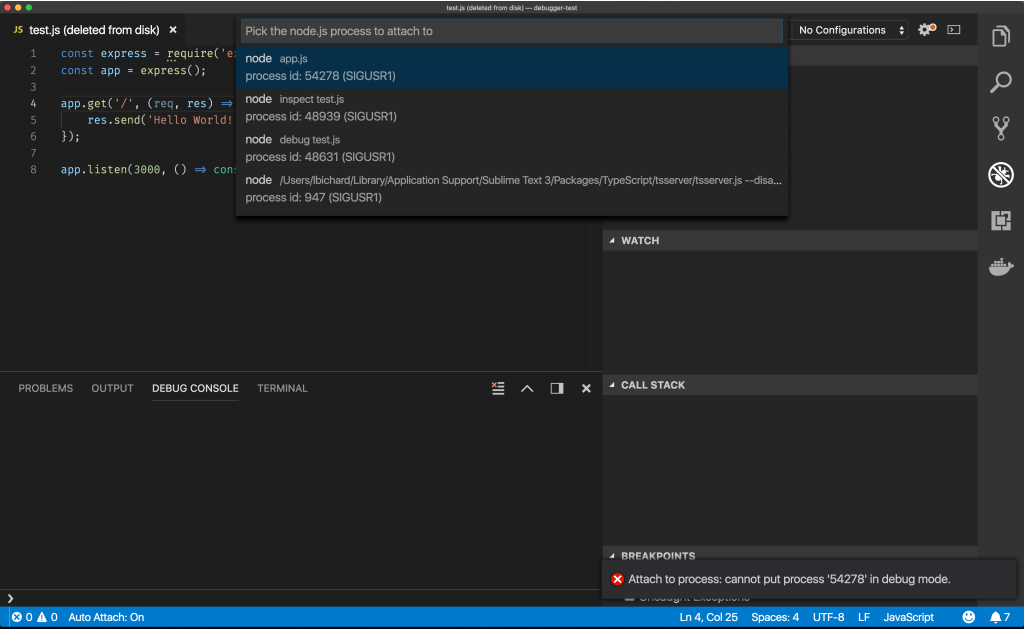
Select Attach to Node Process.
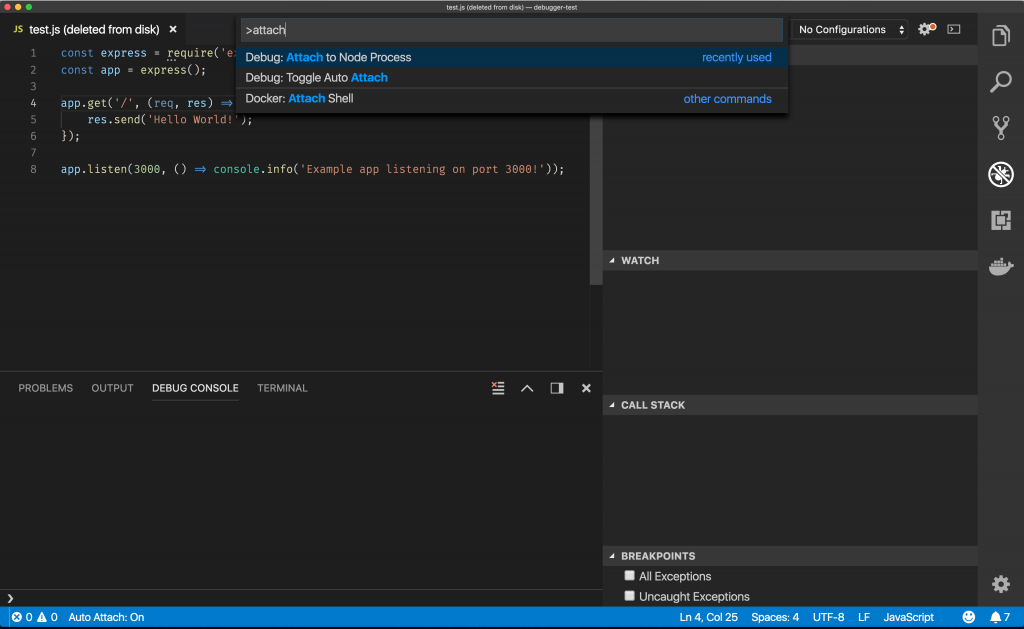
You should now have another menu (shown below) of the running node processes.
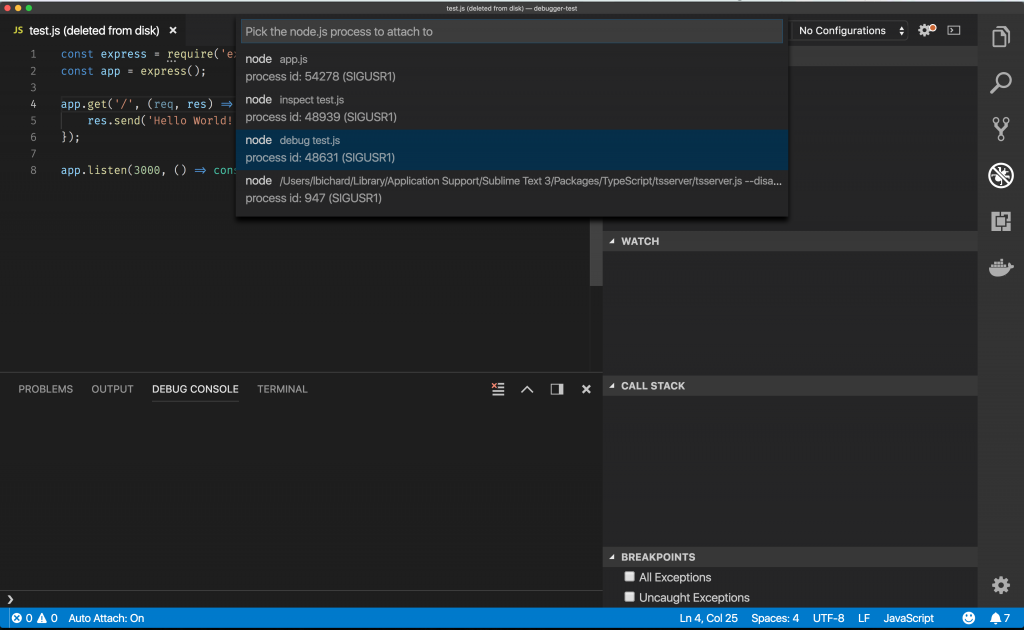
Select the top option to attach the debugger.
Now your running node process is accessible for debugging.
Your console should now show:
Debugger listening on ws://127.0.0.1:9229/d5efc834-41ae-4758-a9e6-4d8767c5752a
Lastly, reopen the command palette and select the debug option.
Your console should now say:
Debugger attached.
And your IDE will show the active orange bottom bar.
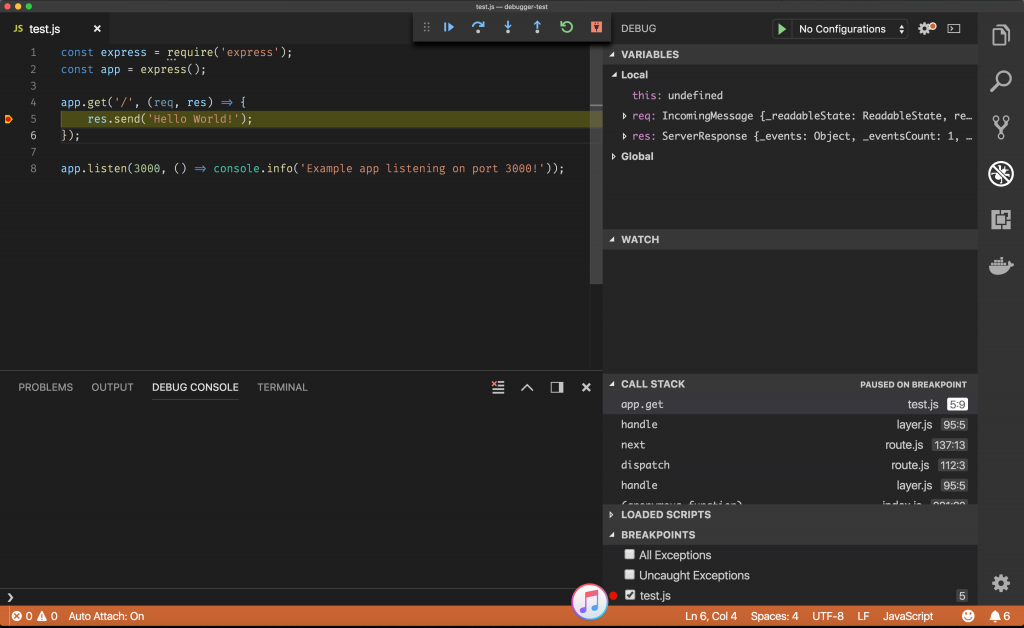
And you’re up and debugging! You can add breakpoints to your code right in your IDE, plus see the scoping of variables and the call stack.
The debugging tools we’ve talked through so far will only work if you’re also executing your software as your users would. A common use case for Node.js is to build RESTful APIs. If you’re building APIs and you’re not familiar with Postman, you’re in for a treat.
Postman is a small application that allows you to set up, save, and run API commands. While running commands such as GET can be easily simulated by navigating through the browser, POST requests aren’t as straightforward. In Postman, you can set up the API requests you want, and fire them off at the click of a button.
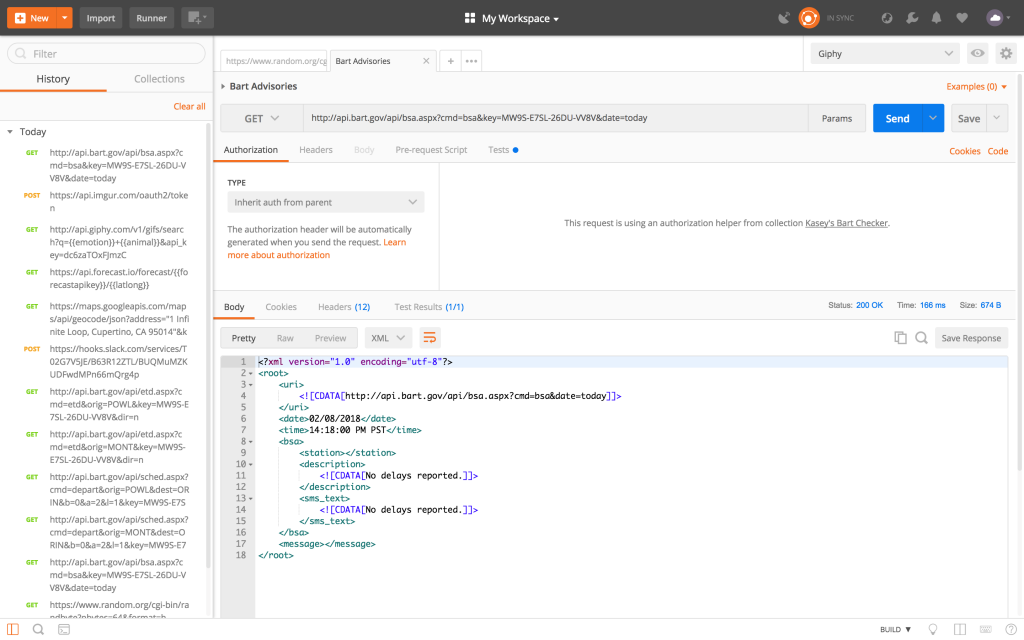
Postman has gotten quite advanced recently, adding ability to do things like pre- and post-scripting. These scripts allow you to dynamically update your requests before they’re sent (for instance, updating a timestamp), or save values from your response to use in subsequent requests. Simply put: you can run a list of chained commands, and pass through the returned values. So if you’re making advanced RESTful APIs with Node.js, Postman is your holy grail.
As much fun as it is to intercept your container requests with inspect and step through your code, you won’t have this option in production. This is why it makes a lot of sense to try and debug your application locally in the same way as you would in production.
In production, one of your tools would be to login to your remote server to view the console logs, just as you would on local. But this can be a tedious approach. Luckily, there are tools out there that perform what is called log aggregation, such as Stackify.
These tools send your logs from your running application into a single location. They often come with high-powered search and query utilities so that you can easily parse your logs and visualize them.
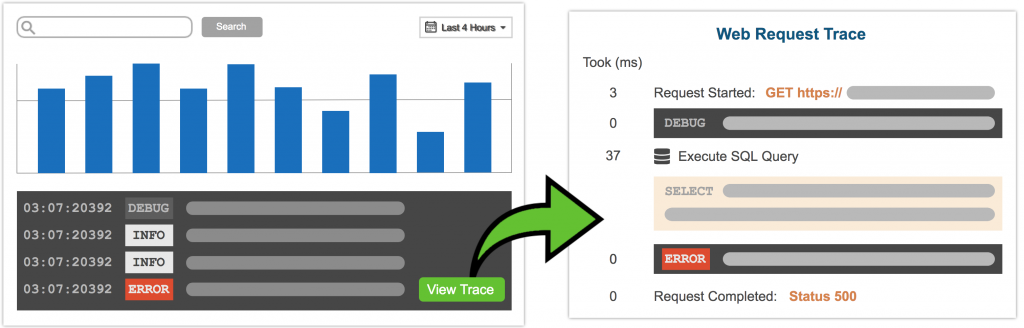
Source: Stackify’s log management tooling
In order to get your logs output, you may also want to use a logging library, such as Winston or Bunyan. These libraries help you format your logs and help with streaming them to your centralized log aggregator systems.
You can also apply logs with a log level. This is an environment-specific configuration that allows you to toggle how fine-grained your log entries are. This can help you to not drown in log entries. It’s not always beneficial to log absolutely everything.
Another tool for remote debugging Node.js is APM (Application Performance Monitoring). APM works by extracting your stack traces inside your code and sending them off to a central location for further analysis, such as with Stackify’s Retrace tooling. Try Retrace’s free, two week trial today.
If you’re serious about building Node.js applications, you’ll want to think about how you’re going to observe and monitor your system from the start, which will likely mean instrumenting your code with logs. The sooner you learn how you need to visualize your Node.js application, the better.
When many think debugging, they think your typical stepping-through-the-debugger-type interactions. However, some issues only show their face during high load. In these cases, you’ll need some way to performance test.
My favorite tool for performance testing Node.js is Artillery.
Artillery allows you to create a YAML configuration file that defines the type of performance tests you want to run. For instance, you might want to simulate how your system behaves during peak load, so you can define a profile that hits your application with low traffic before all of a sudden flooding it with requests.
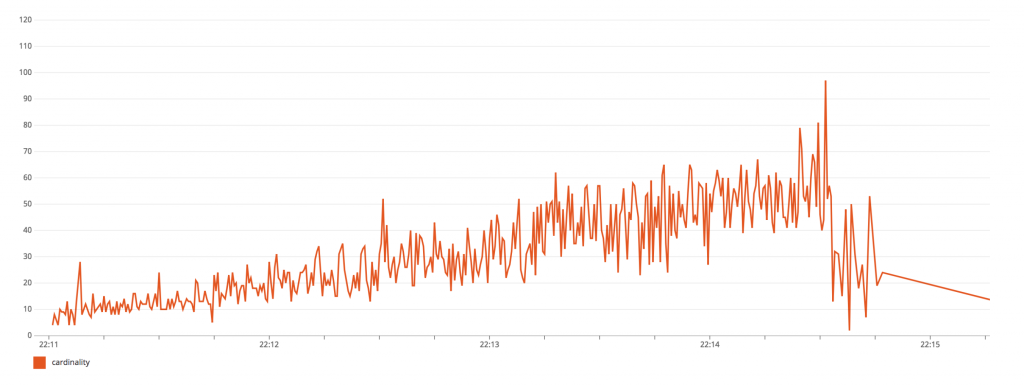
By using tools like Artillery, you can get a much better picture of how your system behaves and help with your debugging.
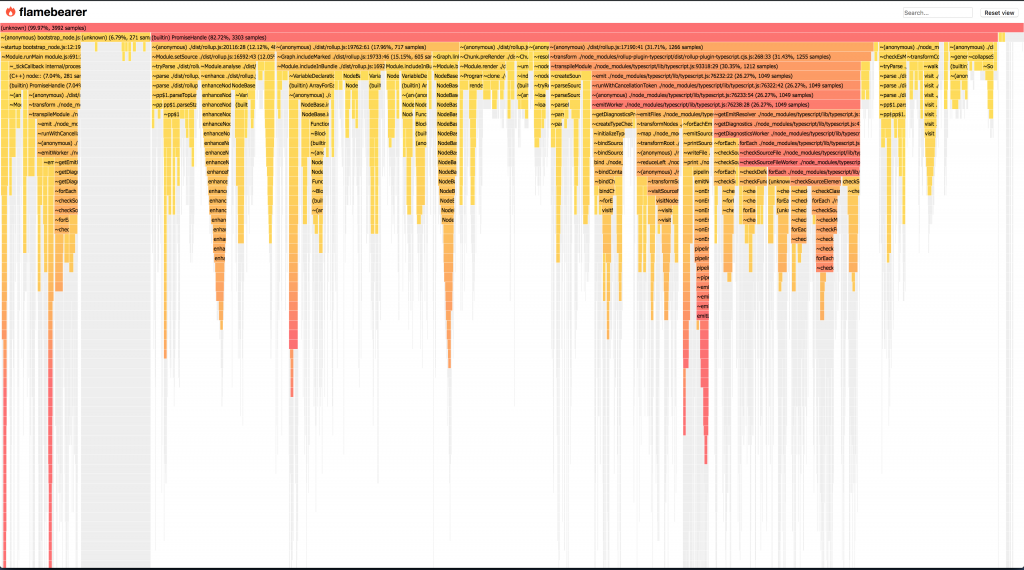
In JavaScript, it’s helpful to understand how your functions are executed, and flame graphs are a great way to visualize how your function execution happens.
A flame graph models your call stack. When a function is executed, it might call another, and another, and another. Eventually at the end of this chain of functions, one will return, which will return to the subsequent function, which will return to the function that called it, and so on until the call stack becomes free again.
This is useful because you will want to see how your application is behaving with respect to your call stack. You might want to see how long functions are running or what other functions they are calling. This is something that simply can’t be done with console.log alone…but it can be done with a flame graph such as flamebearer.
Last up: debugging memory leaks.
A memory leak occurs when there is memory that is not properly freed up, which can lead to increasing amounts of memory being taken up by your application. If never attended to, this can lead to your application running out of memory and potentially crashing. It also means that you might need to provision bigger servers in order to run your leaky application—not good! In JavaScript, memory leaks can be created by (among other things) global variables, closures, or callback functions.
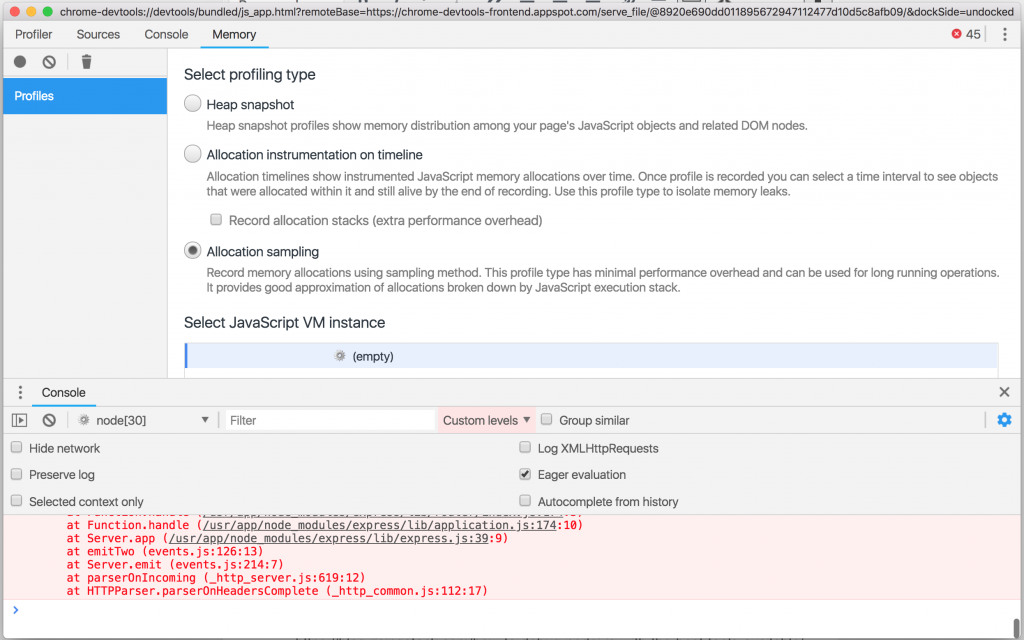
To debug memory leaks, repeat the inspect step from tip four to open up Chrome. Once it’s opened, you will see a memory tab. This allows you to profile your memory usage within your Node.js application and find those pesky leaks!
That’s all we’ve got time for today. Hopefully, we’ve given you some good inspiration and some jumping off points to improve the way you’re debugging in your Node.js applications. Next time you find yourself pulling your hair out throwing console.log statements all over your code, just remember: there are better ways to debug!
So use them—your sanity will thank you!
Stackify's APM tools are used by thousands of .NET, Java, PHP, Node.js, Python, & Ruby developers all over the world.
Explore Retrace's product features to learn more.
If you would like to be a guest contributor to the Stackify blog please reach out to [email protected]


