
JavaScript has come a long way in recent years. Browsers are becoming more robust and machines are growing more powerful. Pair this with the recent development of Node.js for execution of JavaScript on servers, and you can understand why JavaScript has exploded in popularity. Developers continue to push the boundaries of what can be done with JavaScript, which leads to ever more complex applications.
Your ability to effectively debug code becomes increasingly important as the scale of your codebase grows. This article will focus on the essential aspects of client-side JavaScript error logging to help polish up those debugging skills. Unfortunately, server-side error logging is beyond the scope of this article. Rest assured, though, there are plenty of best practices and tools, like Retrace, available to get you started there as well.
Here’s an overview of what I’ll be covering in this article:
When you’re doing local development, you’ve got access to the console. This gives you the ability to recreate errors, peruse stack traces, interpret cryptic error messages, and otherwise debug to your heart’s content. When the page or app reloads, everything in the console disappears. Poof.
This is great during the development process. However, you don’t have access to those console messages once you’ve released your code into the wild and it’s running on users’ machines.
In this case, having some way to send your code’s various error messages from the client to a server you have access to would be beneficial. There are a plethora of tools available for such use cases, typically called logging frameworks, but this article won’t cover them in any depth.
Essentially what these tools do is collect any error messages that occur on the client, and package them up nicely. Once they’re properly bundled, they’re sent to a storage location that you have access to. Handy to have, but a bit complicated to cover here.
With that said, what follows are best practices to observe during that “development phase” of your product when you do have access to the browser console.
You probably got comfortable with the console.log() function the first time you looked at JavaScript. Put it wherever you want in your code and it’ll spit out the contents of whatever you put between the parentheses, right?
It turns out there’s a whole array (pun intended) of methods on the console object that are super useful and often underutilized.
As with many other programming languages, JavaScript has support for logging messages at various levels. They are as follows, with their associated method and a description of their output in the console:
These methods simply provide helpful visual cues for quick debugging in the console. Aside from the visual styling, they all work in exactly the same way.
Your code isn’t just a messy pile (hopefully). Your log output shouldn’t be either. Message grouping can help!
You can use the methods console.group() and console.groupEnd() to create collapsible chunks of log messages in the console. There’s even support for nested groups.
Take, as a quick example, the following code:
console.group("Group heading");
console.log("First line");
console.log("Second line");
console.log("Last line");
console.groupEnd();
This will give you something similar to the following in the console:
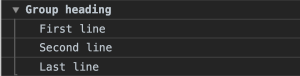
Organizing your log messages by grouping can help you quickly find the messages you care about without wasting time on scrolling or scanning.
There are a multitude of reasons why you might be interested in how long a particular process in your code takes. Fortunately, you don’t have to dig into any complicated third-party tools to get some basic timing functionality.
Take a look at the pseudo-code below:
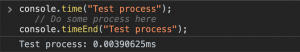
console.time("Test process");
// Do some process here
console.timeEnd("Test process");
The call to console.time() starts a timer with the label “Test process.” Immediately following that, the process on the following line of code (imaginary, in this case) runs. Finally, a call to console.timeEnd(), with the same label of “Test process” passed to it, ends that particular timer.
How handy is that?!
The people working to make JavaScript better are super smart. So, of course, they’ve implemented a tool for us to gracefully handle error-prone code.
Enter the try…catch…finally statement.
This statement allows us to enclose potentially error-producing code in a try block, catch and log an error if there is one, and continue on running our program in the finally block.
Here’s what it looks like:
try {
    // Code to try
} catch (e) {
    // Code to run if an exception (error) occurs
}
finally {
    // This code runs regardless of an error occurring or not
}
Using this pattern will allow you to effectively create error boundaries in your program so that the whole thing doesn’t crash due to a single error.
To better illustrate the usage of the above utilities, let’s go through a (rather contrived) example. Here’s the code, with an explanation to follow:
console.time("Contrived example"); // Start the timer!
try {
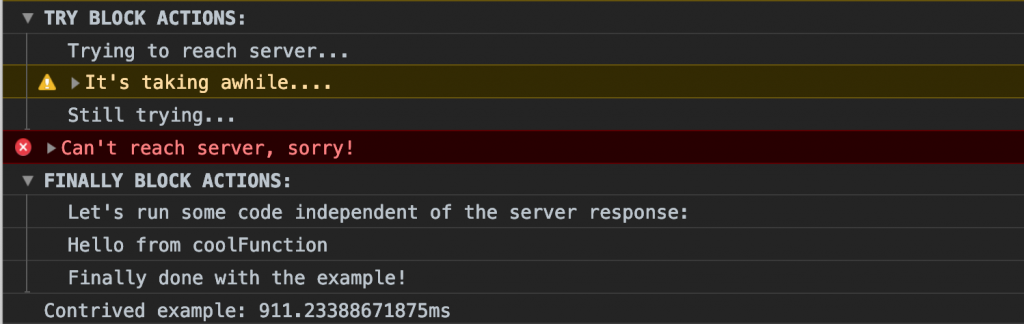
console.group("TRY BLOCK ACTIONS:"); // Create a console grouping
console.log("Trying to reach server...")
console.warn("It's taking awhile...."); // Use the console warn utility so we don't miss it in the console
console.log("Still trying...");
console.groupEnd(); // Close the "TRY BLOCK ACTIONS" grouping
throw new Error("Can't reach server, sorry!"); // Throw an error to be caught in the catch block
} catch(e) {
console.error(e.message); // Log the error thrown from the try block
} finally { // Block of code to execute regardless of errors
console.group("FINALLY BLOCK ACTIONS:"); // Create another console grouping
setTimeout(function() { // Arbitrarily delay code execution for the sake of timing
console.log("Let's run some code independent of the server response:");
coolFunction(); // Call external function
console.log("Finally done with the example!");
console.groupEnd(); // Close the "FINALLY BLOCK ACTIONS" grouping
console.timeEnd("Contrived example"); // Stop timing the code and log the time taken to execute
}, 900);
}
function coolFunction() {
console.log("Hello from coolFunction");
}
The code starts by calling the console.time() method to begin tracking the execution time of the code.
Next, a try block opens up. In the try block, a new console group initiates with a call to console.group(). Plus, a few console.log methods and a console.warn method are called inside it to keep us updated on what’s happening in our code.
After “trying” for a bit, the group is then closed with console.groupEnd() and an error is thrown, which is caught in the catch block. It’s there that the error message is logged with the helpful console.error method.
Lastly, in the finally block, another console group initiates. Also, some more console.log() methods are called inside it, the group closes, and the code timing process terminates with a call to console.timeEnd().
So, what does all of this look like in the console when you run the code? Check it out:
Awesome!
You can expand and collapse the TRY BLOCK ACTIONS and FINALLY BLOCK ACTIONS groupings, see the warn and error color-coding, and see how long the entire process took. That’s powerful stuff.
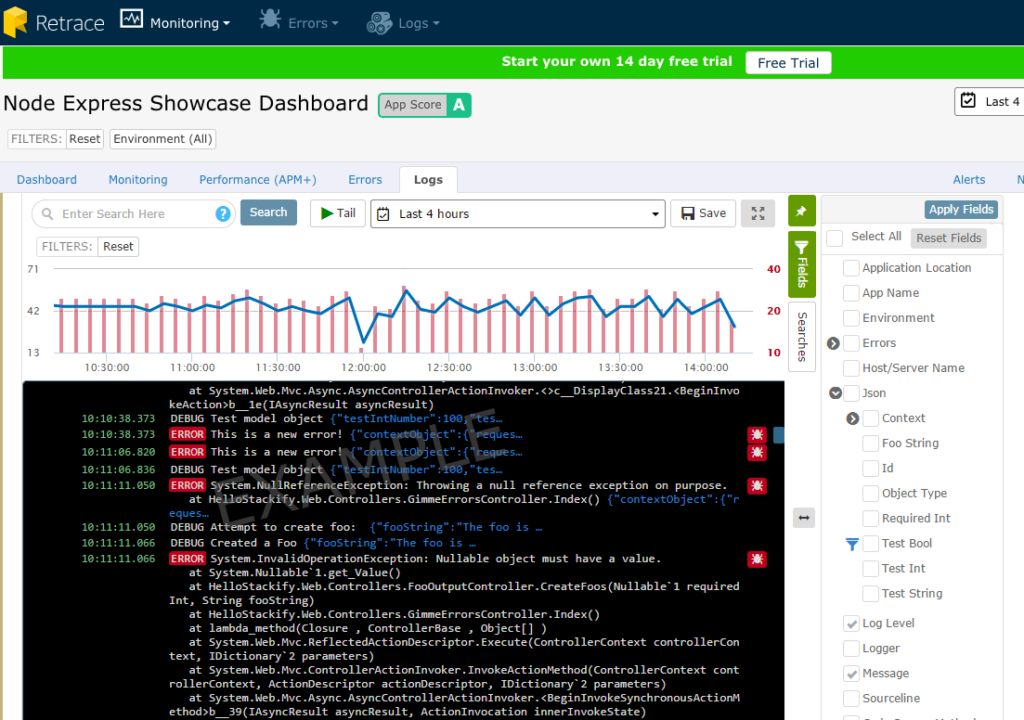
As mentioned earlier, using client-side logging functionality effectively is only a piece (albeit an important one) of your overall development process. If you’re comfortable tracking down issues using the console on your development machine, you can step up your debugging game with some of the more advanced tools like logging frameworks and analysis products like Retrace.
To wrap things up, here are a few key takeaways to start writing better code today:
Now, take your newfound logging power and write incredible code. On to the next project!
Stackify's APM tools are used by thousands of .NET, Java, PHP, Node.js, Python, & Ruby developers all over the world.
Explore Retrace's product features to learn more.
If you would like to be a guest contributor to the Stackify blog please reach out to [email protected]